Fig. 9
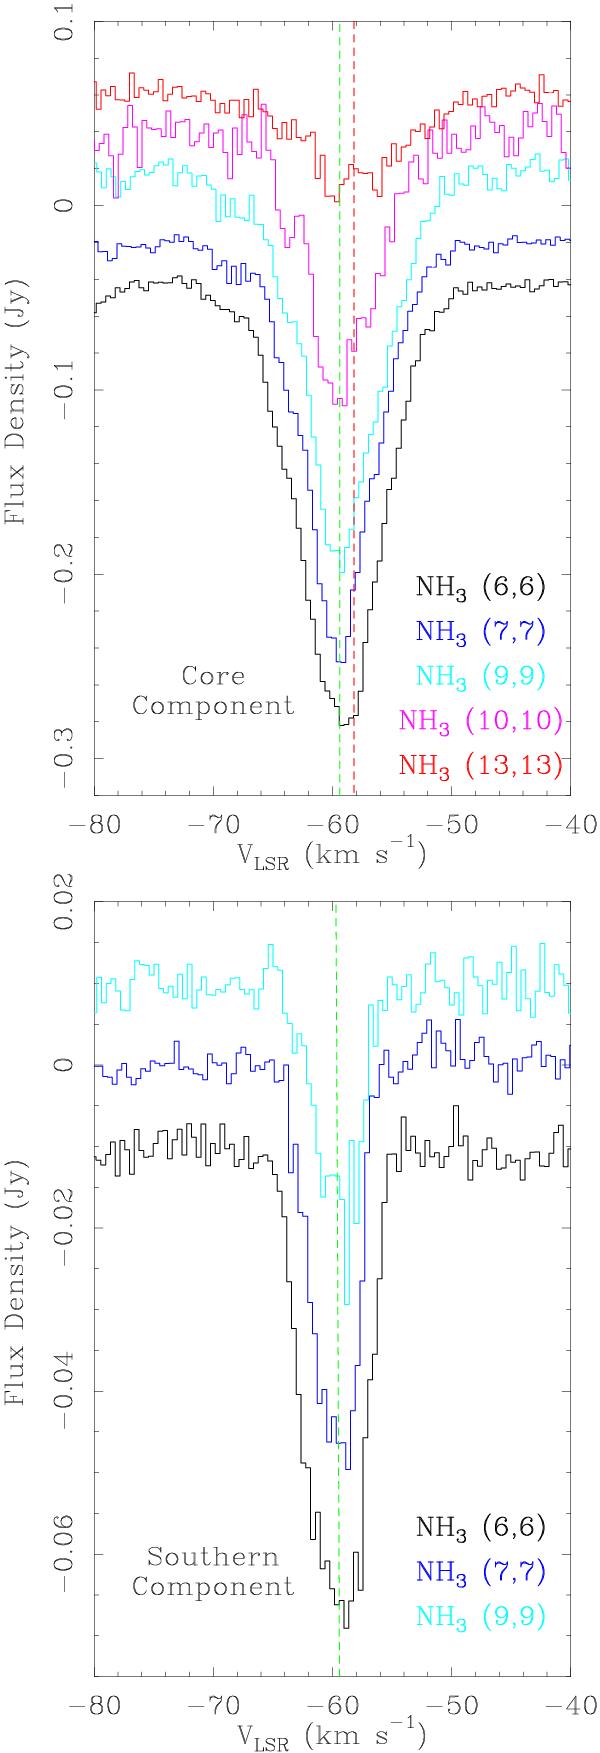
Spectral profiles for NH3 inversion transitions (6,6), (7,7), (9,9), (10,10), and (13,13) observed toward NGC 7538 IRS1 with the JVLA B-Array. The upper panel is showing the spectra integrated over the core component of the 1.3 cm continuum emission (see Fig. 1), and the lower panel the spectra integrated towards the southern spherical component. An offset in flux density was applied to better evidence their spectral profiles. The velocity resolution is 0.4 km s-1 and the l.o.s. velocities are with respect to the local standard of rest (LSR). The dashed green (at −59.4 km s-1) and red (at −58.2 km s-1) lines indicate the central velocity of the least, (6,6), and most, (13,13), excited transitions, respectively, determined by fitting a single Gaussian to the transition spectral profile. In the southern component only the (6,6), (7,7), and (9,9) lines are clearly detected. The upper state energy levels of transitions shown here are ≈408–1693 K.
Current usage metrics show cumulative count of Article Views (full-text article views including HTML views, PDF and ePub downloads, according to the available data) and Abstracts Views on Vision4Press platform.
Data correspond to usage on the plateform after 2015. The current usage metrics is available 48-96 hours after online publication and is updated daily on week days.
Initial download of the metrics may take a while.