Fig. 8
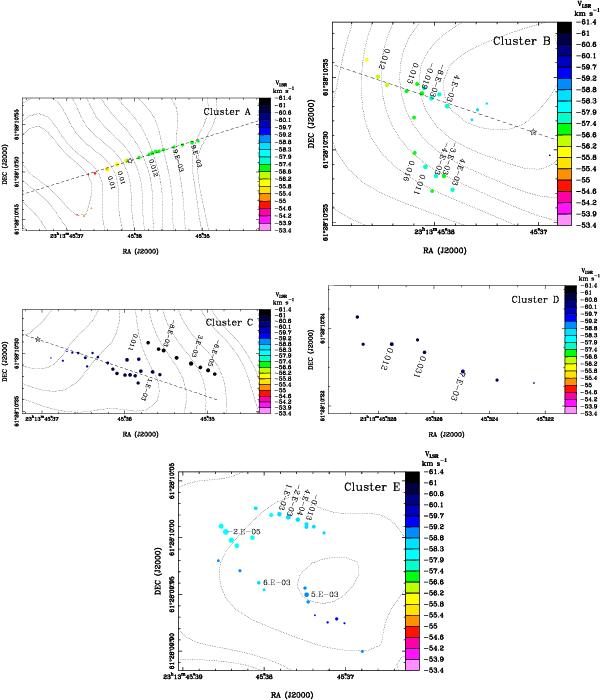
l.o.s. accelerations measured for individual 6.7 GHz maser features. Each panel shows a different cluster, from “A” to “E”. For each maser feature, the value of the l.o.s. acceleration is quoted in km s-1 yr-1. Symbols, colors and contours have the same meaning as in Fig. 1. In panels of the maser clusters “A”, “B” and “C”, the dashed line indicates the major axis of the maser feature’ spatial distribution, and the star marks the reference point to measure axis-projected offsets (see Sect. 4.1).
Current usage metrics show cumulative count of Article Views (full-text article views including HTML views, PDF and ePub downloads, according to the available data) and Abstracts Views on Vision4Press platform.
Data correspond to usage on the plateform after 2015. The current usage metrics is available 48-96 hours after online publication and is updated daily on week days.
Initial download of the metrics may take a while.