Fig. 3
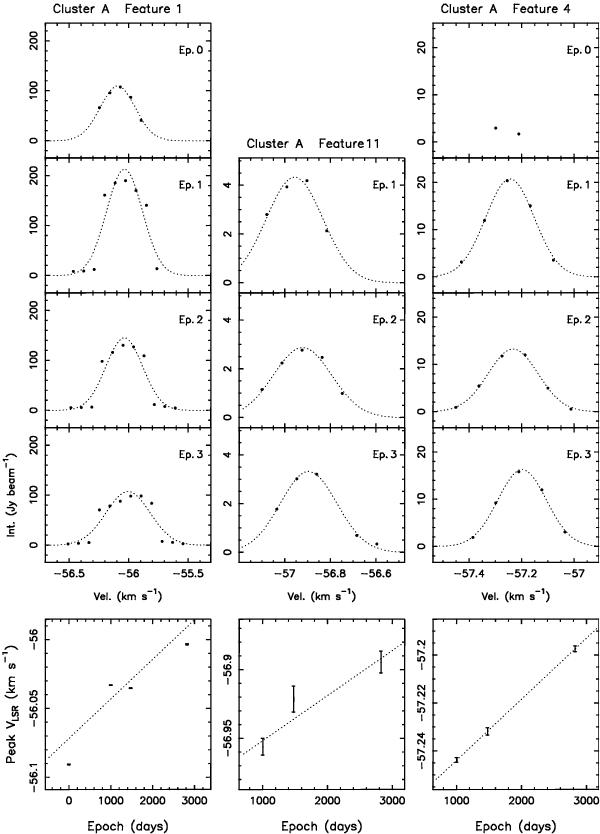
Spectral profiles and time variation in peak velocities of selected maser features of cluster “A”. The plots in each column show a distinct maser feature in the cluster, labeled according to Table 2. (Top panels) Spectral profiles of maser features at different epochs, from Epoch 0 or Epoch 1 down to Epoch 3. The spectra (black dots) are produced by plotting the spot intensity vs. the spot channel velocity. For sufficiently well sampled maser spectra, the dotted curve shows the Gaussian profile fitted to the spectral emission. (Bottom panels) Plot of the maser peak velocity (with the associated errorbar) vs. the observing epoch (expressed in days elapsed from Epoch 0). The dotted line gives the least-square linear fit of velocities vs. time.
Current usage metrics show cumulative count of Article Views (full-text article views including HTML views, PDF and ePub downloads, according to the available data) and Abstracts Views on Vision4Press platform.
Data correspond to usage on the plateform after 2015. The current usage metrics is available 48-96 hours after online publication and is updated daily on week days.
Initial download of the metrics may take a while.