Fig. 2
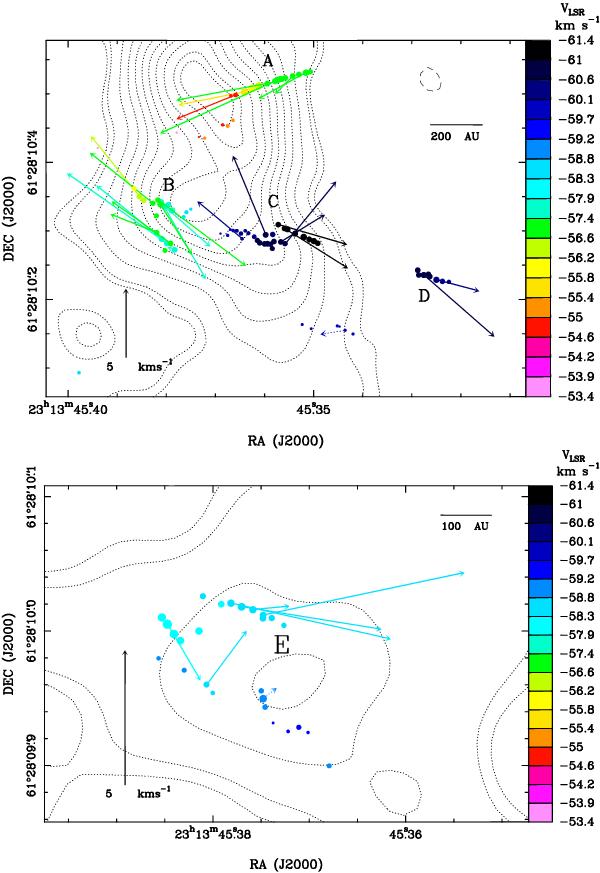
Proper motions of 6.7 GHz CH3OH masers detected over three epochs with the EVN. Symbols, colors and contours have the same meaning as in Fig. 1. The plotted field of view includes the maser clusters “A”, “B”, “C” and “D” (top panel), and cluster “E” (lower panel). Colored arrows show the measured maser proper motions, with dotted arrows denoting the most uncertain measurements. The scale for the proper motion amplitude is given by the black arrow in the lower left corner of each panel.
Current usage metrics show cumulative count of Article Views (full-text article views including HTML views, PDF and ePub downloads, according to the available data) and Abstracts Views on Vision4Press platform.
Data correspond to usage on the plateform after 2015. The current usage metrics is available 48-96 hours after online publication and is updated daily on week days.
Initial download of the metrics may take a while.