Fig. A.1
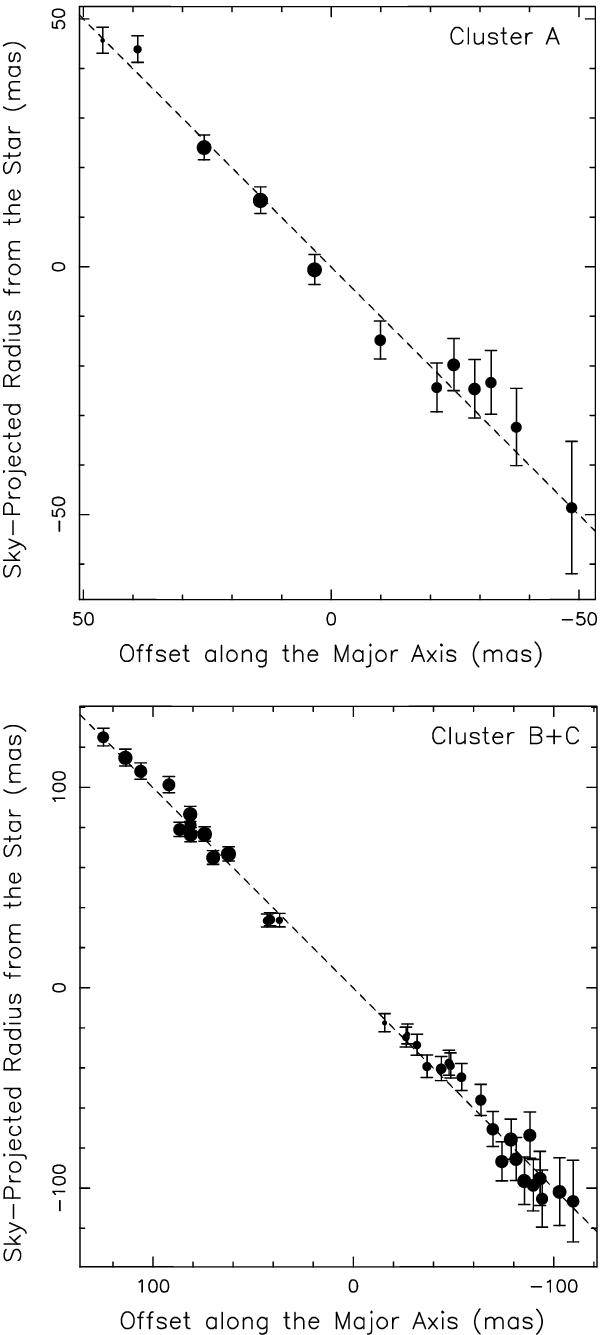
Sky-projected maser radii, derived from the ratio of the maser l.o.s. velocity with the angular velocity (see Sect. A), versus position projected along the major axis of the spatial distribution for the maser cluster “A” (upper panel) and the combined clusters “B” + “C” (lower panel). Dot size is proportional to the logarithm of the maser intensity and vertical errorbars give the estimated errors of the maser radii. The black dashed line denotes the “Y = X” axis.
Current usage metrics show cumulative count of Article Views (full-text article views including HTML views, PDF and ePub downloads, according to the available data) and Abstracts Views on Vision4Press platform.
Data correspond to usage on the plateform after 2015. The current usage metrics is available 48-96 hours after online publication and is updated daily on week days.
Initial download of the metrics may take a while.