Fig. 18
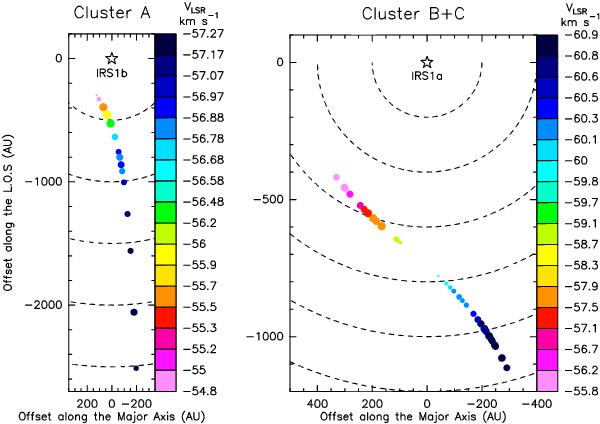
Locations of maser features as derived from the edge-on disk model described in Sect. 5.2, assuming that the masers emerge from the near-side of the disk. Colored dots give the position for features of cluster(s) “A” (left panel) and “B” + “C” (right panel). For each cluster, only the maser features closely aligned along the cluster major axis are considered. Symbols and colors have the same meaning as in Fig. 1. The labeled star marks the YSO position at the disk centre. Dashed arcs indicate circular orbits at steps in radial distance of 500 and 200 AU, for the plot of cluster(s) “A” and ”B” + “C”, respectively.
Current usage metrics show cumulative count of Article Views (full-text article views including HTML views, PDF and ePub downloads, according to the available data) and Abstracts Views on Vision4Press platform.
Data correspond to usage on the plateform after 2015. The current usage metrics is available 48-96 hours after online publication and is updated daily on week days.
Initial download of the metrics may take a while.