Fig. 17
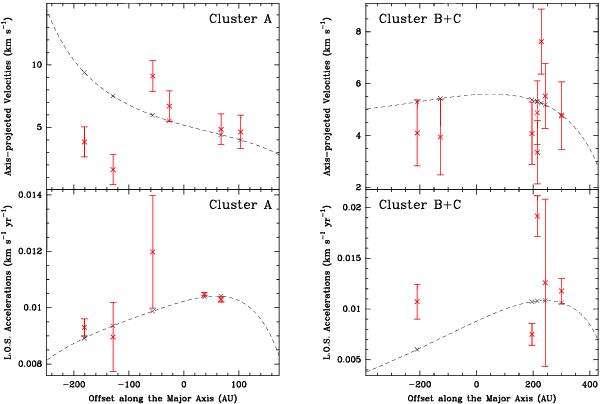
Comparison of the measurements and best-fit values for the cluster “A” (left panels) and clusters “B” + “C” (right panels). Upper and lower panels refer to the velocities (projected along the cluster major-axis) and the l.o.s. accelerations, respectively. Red crosses and errorbars give the measurements and corresponding errors, plotted vs. the maser position. The black dashed line shows the change of the model-predicted quantities along the maser pattern, with black crosses denoting the values in correspondence of the maser positions.
Current usage metrics show cumulative count of Article Views (full-text article views including HTML views, PDF and ePub downloads, according to the available data) and Abstracts Views on Vision4Press platform.
Data correspond to usage on the plateform after 2015. The current usage metrics is available 48-96 hours after online publication and is updated daily on week days.
Initial download of the metrics may take a while.