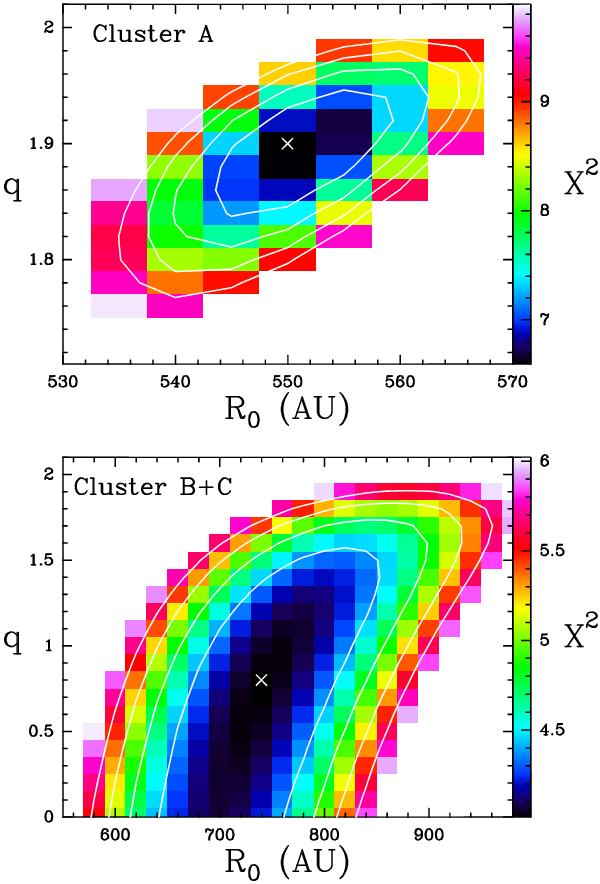
Fig. 16

Result of the model-fit for the cluster “A” (upper panel) and clusters “B” + “C” (lower panel). The colored map shows the distribution of χ2 (calculated using Eq. (20)) around the best-fit position, plotting values from the minimum of χ2 up to 50% above the minimum. The color-value conversion code is shown by the wedge on the right of the panel. The white cross shows the position of the minimum of χ2. The full white contours show levels of 10%, 20%, 30% and 40% above the minimum value of χ2.
Current usage metrics show cumulative count of Article Views (full-text article views including HTML views, PDF and ePub downloads, according to the available data) and Abstracts Views on Vision4Press platform.
Data correspond to usage on the plateform after 2015. The current usage metrics is available 48-96 hours after online publication and is updated daily on week days.
Initial download of the metrics may take a while.


