Fig. 15
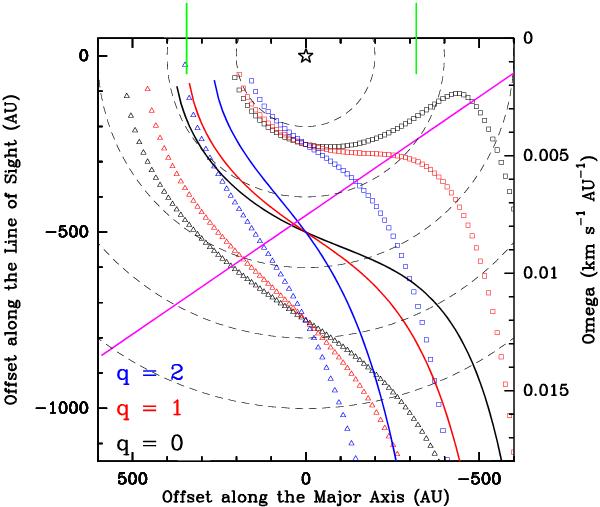
The colored curves are the loci of the 6.7 GHz features, as derived from the edge-on disk model described in Sect. 5.2. We assume that the masers emerge from the near-side of the disk. Maser positions are described by the Eq. (14) (see Sect. 5), using the coefficients α = 7.1 10-5 km s-1 mas-2 and β = 0.020 km s-1 mas-1, derived in Sect. 4.1 fitting the change in maser VLSR with position in the clusters “B” + “C”. The colors black, red and blue identify the maser patterns corresponding to the values of the exponent q equal to 0, 1, and 2, respectively. Light squares, heavy solid line and light triangles are used to plot the curves corresponding to the values of the maser radius at the star position, R0 = 250, 500 and 750 AU, respectively. The star marks the location of the star at the disk centre. The magenta solid line indicates the linear change of the maser angular velocity Ω with the position projected along the cluster major axis. The two green bars mark the range of major-axis projected offset over which the 6.7 GHz masers of the clusters “B” + “C” distribute. Dashed arcs indicate circular orbits at steps of 200 AU in radial distance.
Current usage metrics show cumulative count of Article Views (full-text article views including HTML views, PDF and ePub downloads, according to the available data) and Abstracts Views on Vision4Press platform.
Data correspond to usage on the plateform after 2015. The current usage metrics is available 48-96 hours after online publication and is updated daily on week days.
Initial download of the metrics may take a while.