Fig. 14
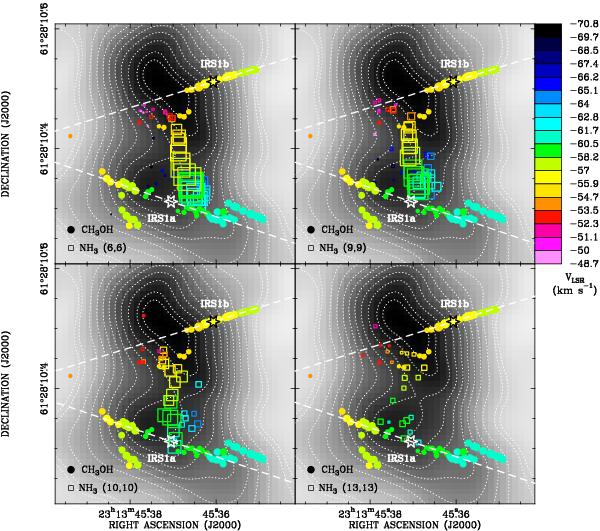
Emission centroids of NH3 fitted as a function of velocity (open squares) and CH3OH masers (filled circles) overlaid on the 1.3 cm continuum map (black image and white contours). Color denotes VLSR (color scale on the right-hand side). The sizes of squares and circles scale linearly and logarithmically with the flux density of NH3 and CH3OH maser emission, respectively. The relative alignment between NH3 and CH3OH is accurate to ~30 mas. Note that NH3 emission distributes between IRS1a and IRS1b, shows a velocity gradients roughly N–S, and is strongest towards IRS1a.
Current usage metrics show cumulative count of Article Views (full-text article views including HTML views, PDF and ePub downloads, according to the available data) and Abstracts Views on Vision4Press platform.
Data correspond to usage on the plateform after 2015. The current usage metrics is available 48-96 hours after online publication and is updated daily on week days.
Initial download of the metrics may take a while.