Fig. 13
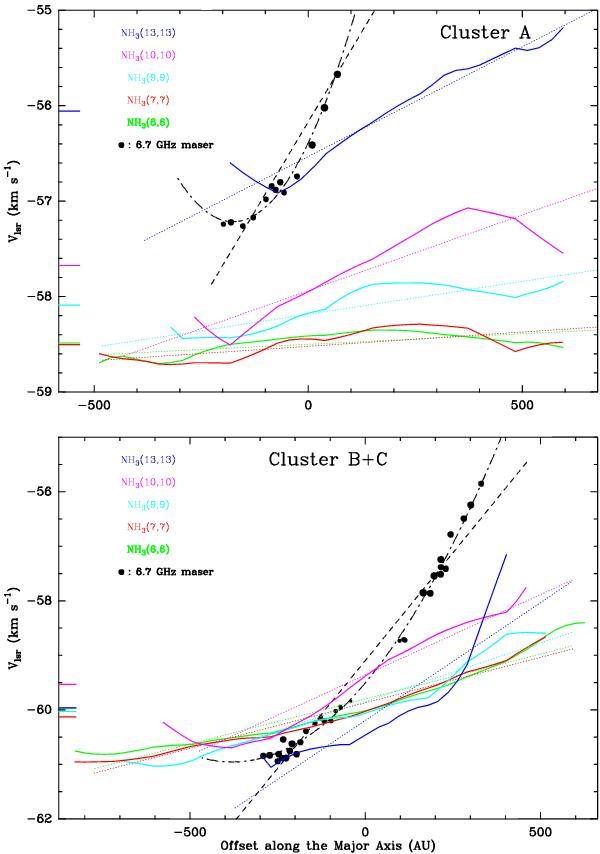
Colored curves show strips of the first-moment map of different NH3 transitions, taken along the major axis of the maser clusters “A” (upper panel) and “B” + “C” (lower panel) . Colored bars along the “Y” axis mark the mean VLSR of the NH3 lines. The association color–NH3 transition is indicated in the upper left corner of the panel. Black dots report the 6.7 GHz masers of the clusters, selecting only the features closely aligned along the cluster major axis. Dot size is proportional to the logarithm of the maser intensity. The linear and quadratic fits to the maser distribution are indicated with a black dashed and black dot-dashed line, respectively. Colored dotted lines show the linear fits to the first-moment strips of the NH3 transitions.
Current usage metrics show cumulative count of Article Views (full-text article views including HTML views, PDF and ePub downloads, according to the available data) and Abstracts Views on Vision4Press platform.
Data correspond to usage on the plateform after 2015. The current usage metrics is available 48-96 hours after online publication and is updated daily on week days.
Initial download of the metrics may take a while.