Fig. 12
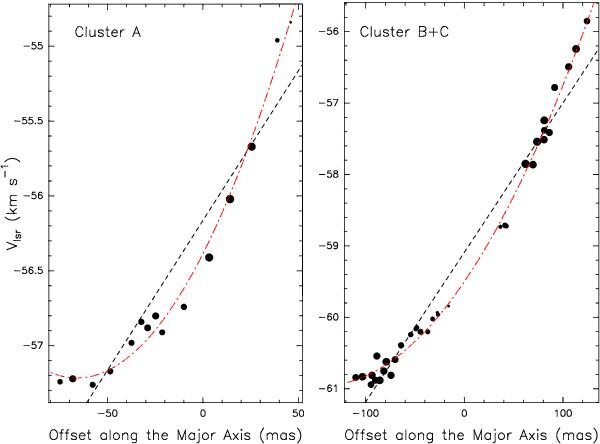
Maser VLSR versus position projected along the major axis of the spatial distribution for the maser cluster(s) “A” (left panel) and “B” + “C” (right panel). The positional offsets are measured with respect to the YSO positions shown in Fig. 11. Maser (relative) positions and VLSR are known with an accuracy better than 1 mas (see Table 2) and 0.1 km s-1 (see Table 1), respectively. These plots are produced considering only the features closely aligned along the cluster major axis. Dot size is proportional to the logarithm of the maser intensity. The linear and quadratic fit to the plotted distribution is indicated with a black dashed and red dot-dashed line, respectively.
Current usage metrics show cumulative count of Article Views (full-text article views including HTML views, PDF and ePub downloads, according to the available data) and Abstracts Views on Vision4Press platform.
Data correspond to usage on the plateform after 2015. The current usage metrics is available 48-96 hours after online publication and is updated daily on week days.
Initial download of the metrics may take a while.