Fig. 11
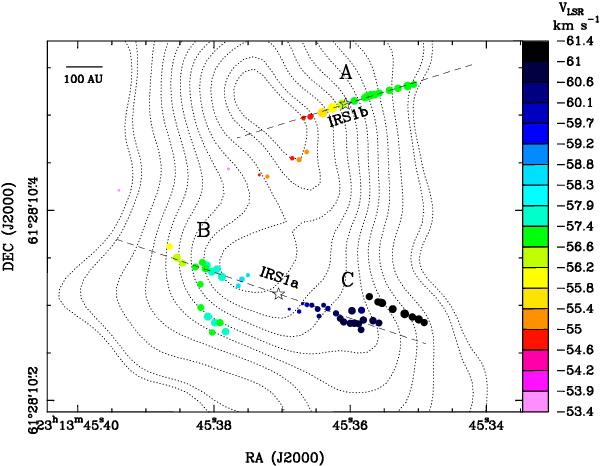
Linear fits to the spatial distributions of maser features in cluster “A”, and in the combined clusters “B” + “C” (dashed lines). Symbols, colors and contours have the same meaning as in Fig. 1. To fit the maser spatial distribution in these clusters, we have selected a subset of features closely aligned along the cluster major axis, excluding the subgroup of weak features scattered to the SE of cluster “A”, the subgroup of features of cluster “B” lying further south, and the subgroup in cluster “C” more detached to NW. The stars labeled IRS1a and IRS1b mark the YSO positions, as discussed in Sect. 6.
Current usage metrics show cumulative count of Article Views (full-text article views including HTML views, PDF and ePub downloads, according to the available data) and Abstracts Views on Vision4Press platform.
Data correspond to usage on the plateform after 2015. The current usage metrics is available 48-96 hours after online publication and is updated daily on week days.
Initial download of the metrics may take a while.