Fig. 10
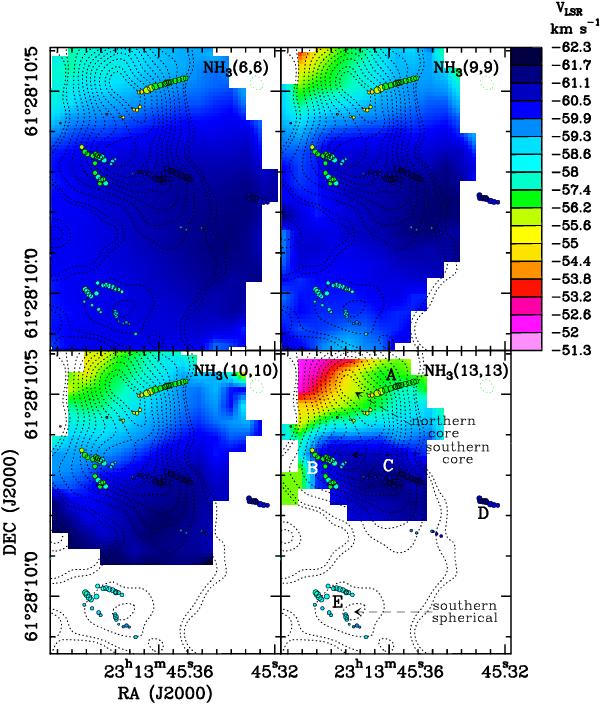
Velocity fields of four inversion transitions of NH3, (6,6), (9,9), (10,10), and (13,13), as measured towards NGC 7538 IRS1 with the JVLA B-Array. In each panel, the positions of the 6.7 GHz CH3OH masers (black-circled, colored dots) are overlaid on the NH3 image. The conversion code between colors and VLSR is indicated in the wedge to the right side of the upper right panel. Dot size is proportional to the logarithm of the maser intensity. Dotted contours have the same meaning as in Fig. 1. In the bottom right panel, the labels of the maser clusters and the names of the main 1.3 cm continuum peaks are given.
Current usage metrics show cumulative count of Article Views (full-text article views including HTML views, PDF and ePub downloads, according to the available data) and Abstracts Views on Vision4Press platform.
Data correspond to usage on the plateform after 2015. The current usage metrics is available 48-96 hours after online publication and is updated daily on week days.
Initial download of the metrics may take a while.