Fig. 1
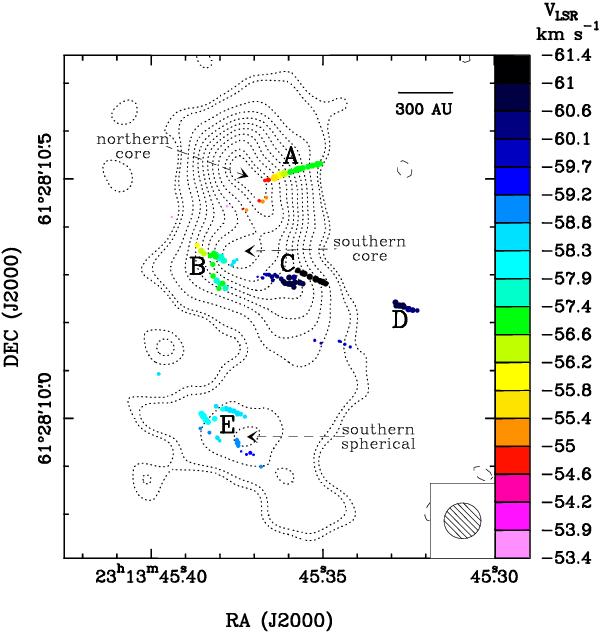
6.7 GHz CH3OH masers detected over three epochs with the EVN, overlaid on the 1.3 cm continuum imaged with the VLA A-Array. Colored dots show the absolute position of individual maser features, with color denoting the maser VLSR, according to the color-velocity conversion code reported on the right side of the panel4. Maser absolute positions are relative to the epoch 2005 September 9, which is the first of the five VLBA epochs used by Moscadelli et al. (2009) to measure absolute positions and proper motions of the 12 GHz CH3OH masers in NGC 7538 IRS1. Dot size is proportional to the logarithm of the maser intensity. Masers are grouped in different clusters, labeled using capital letters from “A” to “E”. The 1.3 cm map (dotted contours) was produced using archival data, originally reported by Gaume et al. (1995). Plotted contours are 7%, 10% to 90% (in steps of 10%), and 95% of the map peak, 0.022 Jy beam-1. Dotted arrows point to the main 1.3 cm continuum peaks, which are named following the notation by Gaume et al. (1995). The beam of the VLA-A 1.3 cm observations is reported in the insert in the bottom right of the panel.
Current usage metrics show cumulative count of Article Views (full-text article views including HTML views, PDF and ePub downloads, according to the available data) and Abstracts Views on Vision4Press platform.
Data correspond to usage on the plateform after 2015. The current usage metrics is available 48-96 hours after online publication and is updated daily on week days.
Initial download of the metrics may take a while.