Fig. 3
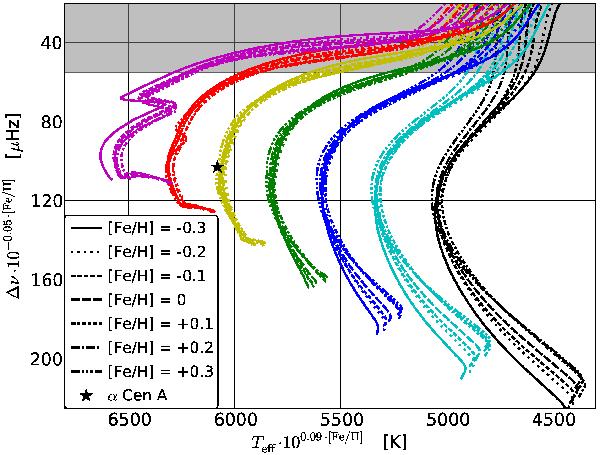
Plot used to determine the mass of α Cen A. The colours give the masses of the lines ranging from 0.7 M⊙ (black) in the right of the figure in steps of 0.1 M⊙ to 1.3 M⊙ (magenta/purple) in the left of the figure. The different line types give the metallicity. The star shows the location of α Cen A in the figure. The shaded area in the top indicates the region where another mass plot would be more suitable.
Current usage metrics show cumulative count of Article Views (full-text article views including HTML views, PDF and ePub downloads, according to the available data) and Abstracts Views on Vision4Press platform.
Data correspond to usage on the plateform after 2015. The current usage metrics is available 48-96 hours after online publication and is updated daily on week days.
Initial download of the metrics may take a while.