Fig. 2
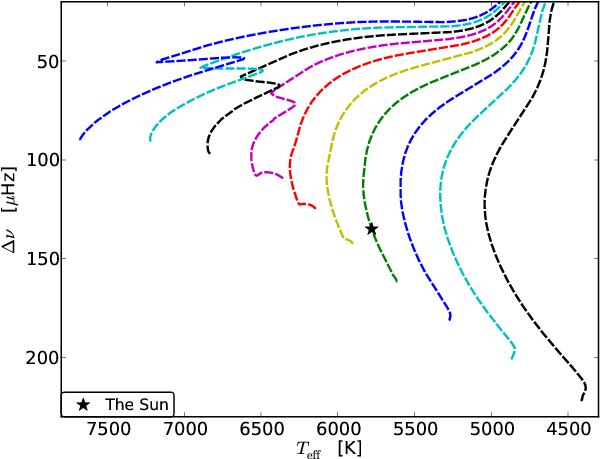
Evolutionary tracks for models with varying mass and solar metallicity plotted in a variation of a classic H-R diagram (Δν plotted against Teff). The star shows the location of the Sun and the different line colours represent different masses starting with the black 0.7 M⊙ line on the far right going in increments of 0.1 M⊙ to the blue 1.6 M⊙ line on the far left.
Current usage metrics show cumulative count of Article Views (full-text article views including HTML views, PDF and ePub downloads, according to the available data) and Abstracts Views on Vision4Press platform.
Data correspond to usage on the plateform after 2015. The current usage metrics is available 48-96 hours after online publication and is updated daily on week days.
Initial download of the metrics may take a while.