Fig. A.2
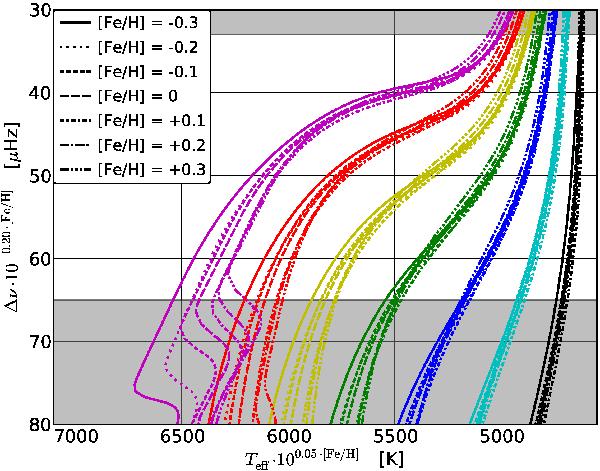
Plot for determining the stellar mass. The colours give the masses of the lines ranging from 0.7 M⊙ (black) in steps of 0.1 M⊙ to 1.3 M⊙ (magenta/purple). The different line types are explained in the legend. The shaded areas in the figure indicate where Fig. A.1 should be used instead (bottom) and where the lines are hard to disentangle (top).
Current usage metrics show cumulative count of Article Views (full-text article views including HTML views, PDF and ePub downloads, according to the available data) and Abstracts Views on Vision4Press platform.
Data correspond to usage on the plateform after 2015. The current usage metrics is available 48-96 hours after online publication and is updated daily on week days.
Initial download of the metrics may take a while.