Fig. 11
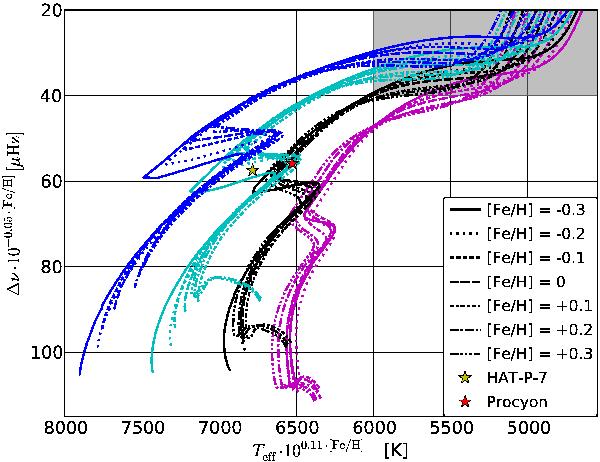
Plot used to determine the mass for high mass stars. The different line colours signify the masses of the lines ranging from 1.3 M⊙ (magenta/purple) to 1.6 M⊙ (blue) in steps of 0.1 M⊙. The various line types indicate the metallicity. The shaded area shows where the lines start to become hard to separate. The yellow star indicates the position of HAT-P-7 whilst the red star gives the location of Procyon in the plot.
Current usage metrics show cumulative count of Article Views (full-text article views including HTML views, PDF and ePub downloads, according to the available data) and Abstracts Views on Vision4Press platform.
Data correspond to usage on the plateform after 2015. The current usage metrics is available 48-96 hours after online publication and is updated daily on week days.
Initial download of the metrics may take a while.