Fig. 1
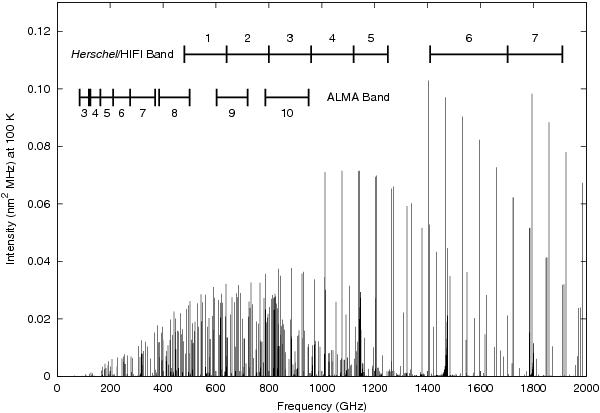
Spectral intensity distribution of CH2NH at 100 K Both a-type and b-type transitions are depicted. The ALMA and Herschel band designations are also shown. As described in the text, the most intense peak appeared around 1.5 THz, which is a common feature for all other isotopologs studied in the present paper.
Current usage metrics show cumulative count of Article Views (full-text article views including HTML views, PDF and ePub downloads, according to the available data) and Abstracts Views on Vision4Press platform.
Data correspond to usage on the plateform after 2015. The current usage metrics is available 48-96 hours after online publication and is updated daily on week days.
Initial download of the metrics may take a while.