Fig. 4
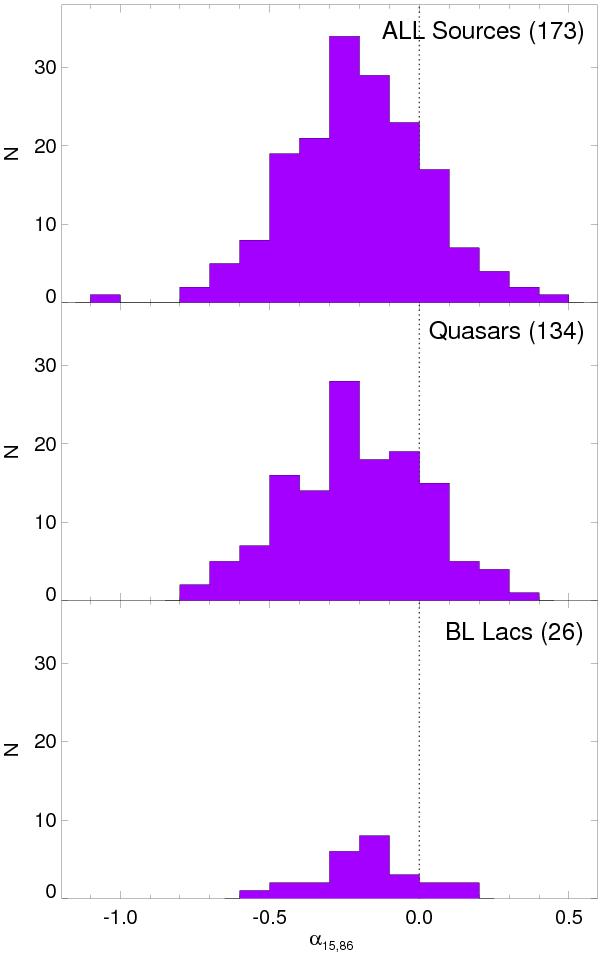
Distribution of 15 GHz to 86 GHz spectral indices (α15, 86) for all sources in both the MOJAVE and our sample, and their corresponding quasar and BL Lac sub-samples. The 15 GHz total flux density was taken from integrated intensity of MOJAVE images. For each source, the 15 GHz observation taken at the closest date to our 86 GHz measurement was selected. Numbers in parentheses denote sample sizes.
Current usage metrics show cumulative count of Article Views (full-text article views including HTML views, PDF and ePub downloads, according to the available data) and Abstracts Views on Vision4Press platform.
Data correspond to usage on the plateform after 2015. The current usage metrics is available 48-96 hours after online publication and is updated daily on week days.
Initial download of the metrics may take a while.