Fig. 7
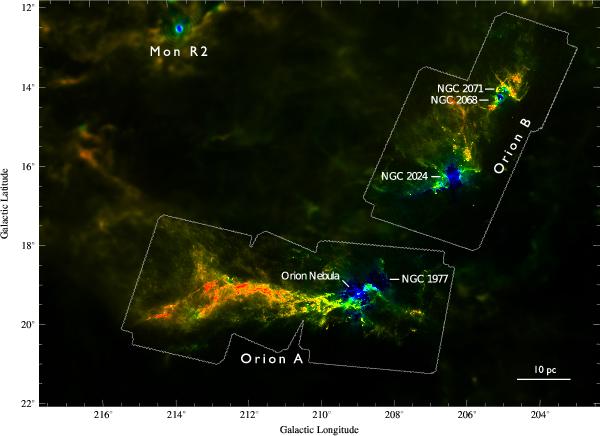
Combined optical depth-temperature map for Orion A and B. The image shows the optical-depth as intensity and the temperature as hue, with red (blue) corresponding to low temperatures (high temperatures). By comparing this image with the one shown inone can appreciate that regions with relatively high temperatures emit much higher fluxes even if the optical-depth is substantially lower.
Current usage metrics show cumulative count of Article Views (full-text article views including HTML views, PDF and ePub downloads, according to the available data) and Abstracts Views on Vision4Press platform.
Data correspond to usage on the plateform after 2015. The current usage metrics is available 48-96 hours after online publication and is updated daily on week days.
Initial download of the metrics may take a while.