Fig. 5
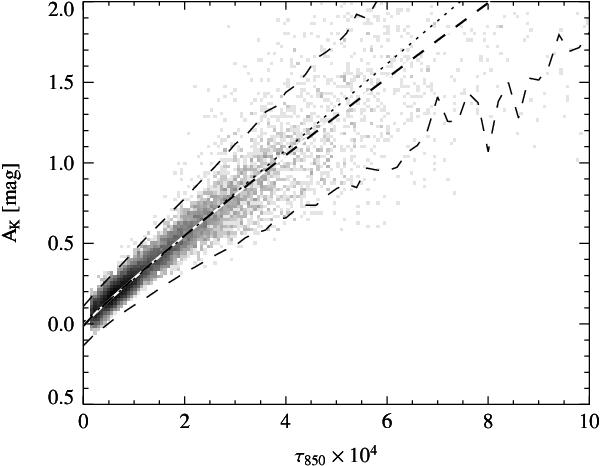
Same as Fig. 3, but for a wider range of values. The plot shows hints of non-linearity for high values of dust column densities or optical-depths, as shown by the curved fit (dashed line). We also report in this plot the linear fit obtained in the range of Fig. 3 (dotted line). A direct comparison between the results obtained fromshows how important it is to account for unresolved substructures and foreground stars in molecular clouds.
Current usage metrics show cumulative count of Article Views (full-text article views including HTML views, PDF and ePub downloads, according to the available data) and Abstracts Views on Vision4Press platform.
Data correspond to usage on the plateform after 2015. The current usage metrics is available 48-96 hours after online publication and is updated daily on week days.
Initial download of the metrics may take a while.