Fig. 2
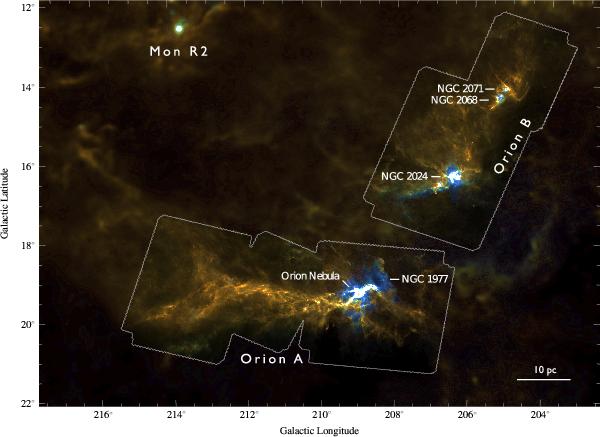
Composite three-color image showing the Herschel/SPIRE intensities for the region considered, where available (with the 250 μm, 350 μm, and 500 μm bands shown in blue, green, and red). For regions outside the Herschel coverage, we used the Planck/IRAS dust model (τ850,T,β) to predict the intensity that would be observed at the SPIRE passbands. Note that the transition from Herschel to Planck is only visible because of the different resolution, and that otherwise there is no obvious discontinuity in the intensities.
Current usage metrics show cumulative count of Article Views (full-text article views including HTML views, PDF and ePub downloads, according to the available data) and Abstracts Views on Vision4Press platform.
Data correspond to usage on the plateform after 2015. The current usage metrics is available 48-96 hours after online publication and is updated daily on week days.
Initial download of the metrics may take a while.