Fig. 7
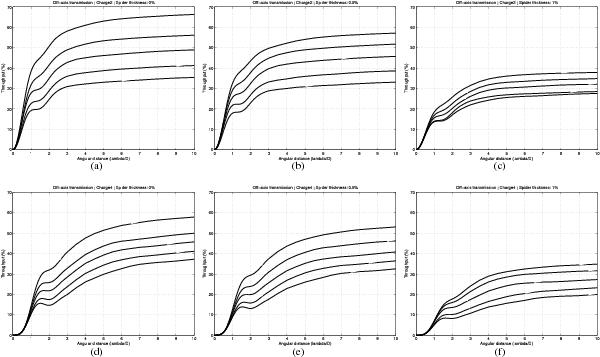
Transmission (in %) of an off-axis source as a function of the distance to the star (in units of λ/D), for a) and d) apertures with no spiders; b) and e) apertures with 0.5% thick spiders; and c) and f) apertures with 1% thick spiders. Figures a), b), and c) correspond to a charge 2 VC; and figures d), e), and f) correspond to a charge 4 VC. In each case, the transmission is given for the five central obscurations: 10, 15, 20, 25, and 30% (from top to bottom). The red dots indicate the IWA of each coronagraph.
Current usage metrics show cumulative count of Article Views (full-text article views including HTML views, PDF and ePub downloads, according to the available data) and Abstracts Views on Vision4Press platform.
Data correspond to usage on the plateform after 2015. The current usage metrics is available 48-96 hours after online publication and is updated daily on week days.
Initial download of the metrics may take a while.