Fig. 3
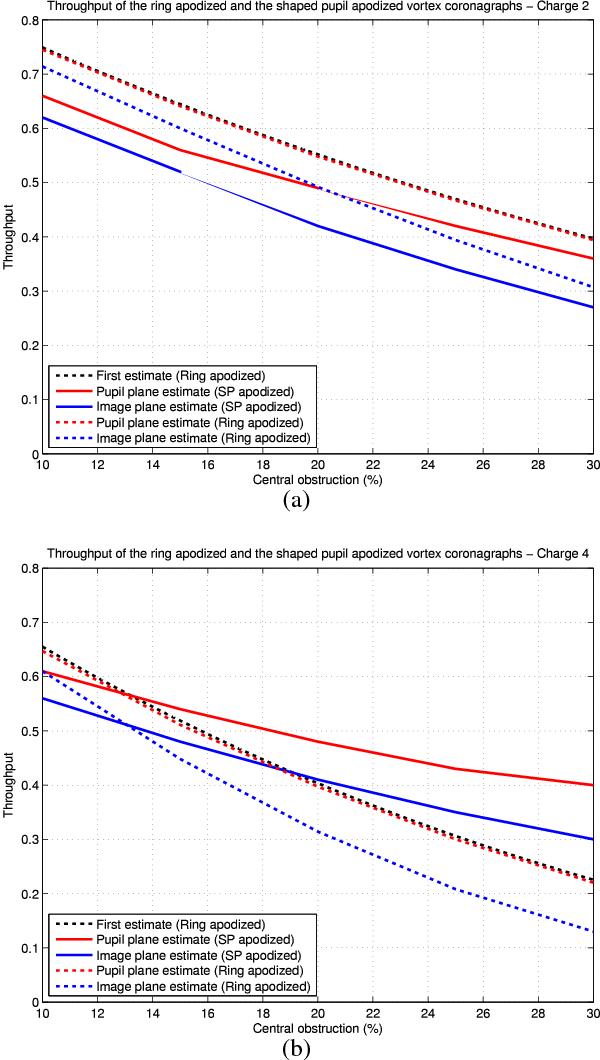
Comparison of the throughputs estimates of the ring apodized VC (dotted lines) and the shaped pupil apodized VC (solid lines) for topological charges 2 and 4. Different measures of the throughput are illustrated. Pupil plane estimates are showed in red, while image plane estimates are showed in blue. The dotted black line represents the throughputs given in Mawet et al. (2013b).
Current usage metrics show cumulative count of Article Views (full-text article views including HTML views, PDF and ePub downloads, according to the available data) and Abstracts Views on Vision4Press platform.
Data correspond to usage on the plateform after 2015. The current usage metrics is available 48-96 hours after online publication and is updated daily on week days.
Initial download of the metrics may take a while.