Fig. 10
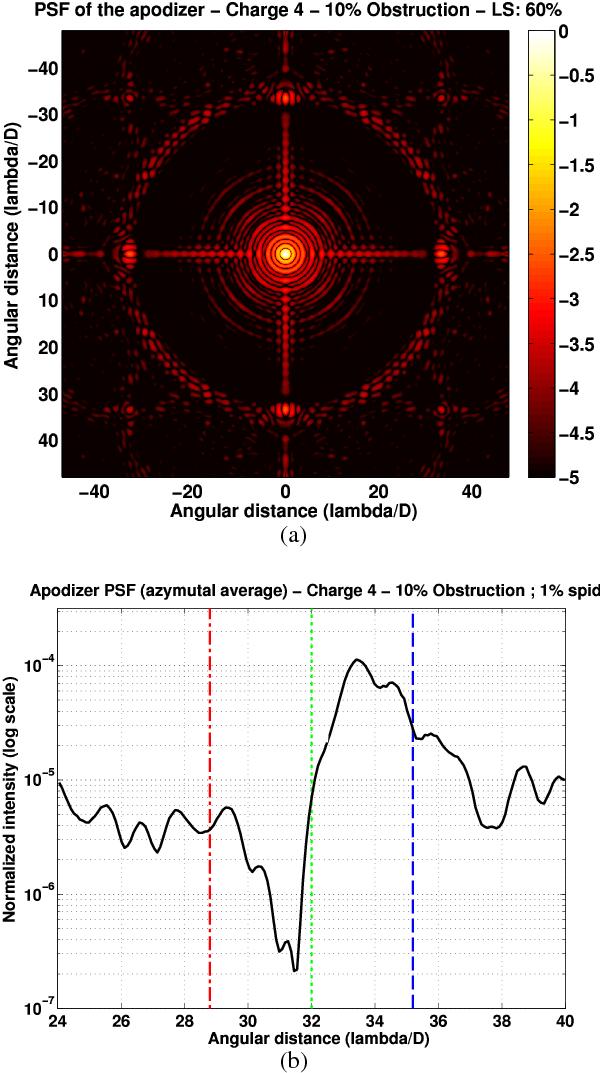
2D a) and azymutal average b) of the PSF of the optimal apodizer designed for a 10% central obscuration, 1% thick spiders, and a charge 4 vortex. In the azymutal average, the red dot-dashed line denotes the highest spatial frequency captured by the mask at λ = 1.1λ0, the blue dashed line does the same λ = 0.9λ0, and the dotted green line does it at λ = λ0.
Current usage metrics show cumulative count of Article Views (full-text article views including HTML views, PDF and ePub downloads, according to the available data) and Abstracts Views on Vision4Press platform.
Data correspond to usage on the plateform after 2015. The current usage metrics is available 48-96 hours after online publication and is updated daily on week days.
Initial download of the metrics may take a while.