Fig. 6
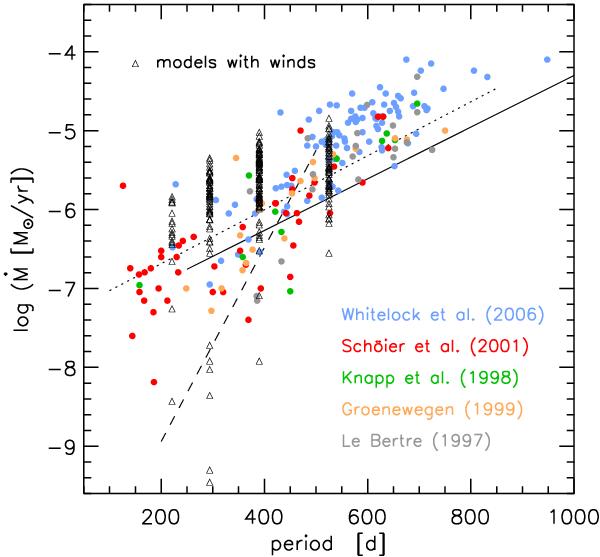
Mass-loss rate as a function of pulsation period for the models with winds, plotted as black triangles compared to observations of various galactic C-rich targets from various sources. The plotted relations come from Vassiliadis & Wood (1993) (dashed line), Groenewegen et al. (1998, their Eq. (9), C-miras; solid line), and De Beck et al. (2010, fit on their page 21; dotted line).
Current usage metrics show cumulative count of Article Views (full-text article views including HTML views, PDF and ePub downloads, according to the available data) and Abstracts Views on Vision4Press platform.
Data correspond to usage on the plateform after 2015. The current usage metrics is available 48-96 hours after online publication and is updated daily on week days.
Initial download of the metrics may take a while.