Fig. 4
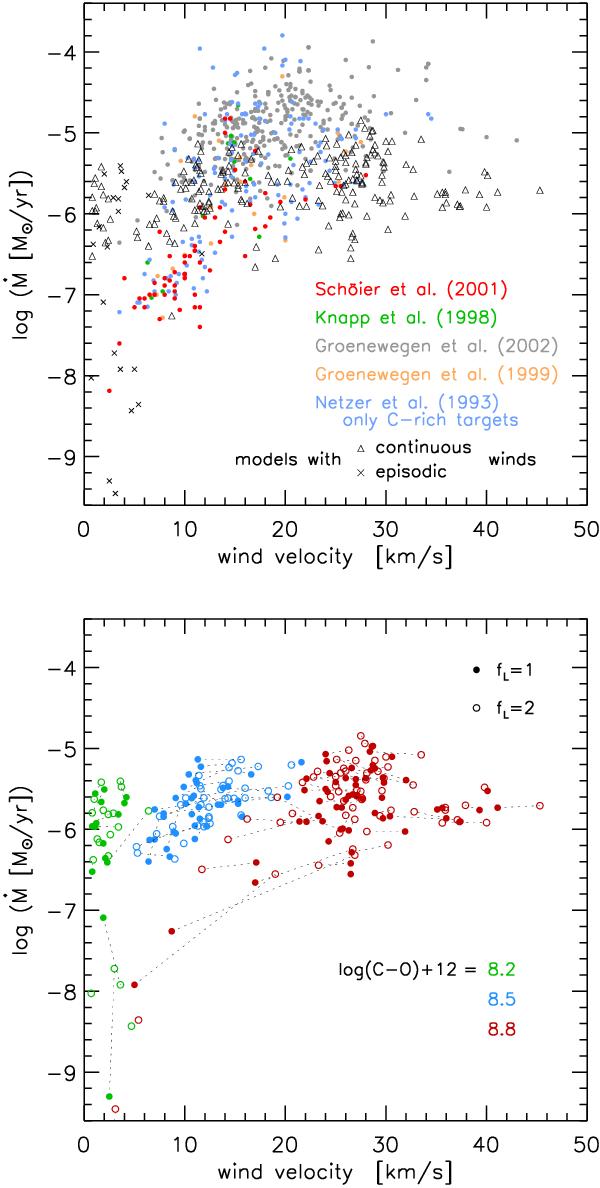
Mass-loss rate plotted versus the wind velocity for all models with outflows. In the upper panel the triangles mark models with steady winds while the crosses denote models with episodic winds. The other symbols with different colours show values based on observations of various C-rich giants, adopted from different sources as given by the legend. The lower panel shows the values for the models which have winds for both fL = 1 and fL = 2. The latter are plotted as open circles and models with identical parameters except fL are connected. The different colours denote various carbon excesses.
Current usage metrics show cumulative count of Article Views (full-text article views including HTML views, PDF and ePub downloads, according to the available data) and Abstracts Views on Vision4Press platform.
Data correspond to usage on the plateform after 2015. The current usage metrics is available 48-96 hours after online publication and is updated daily on week days.
Initial download of the metrics may take a while.