Fig. C.2
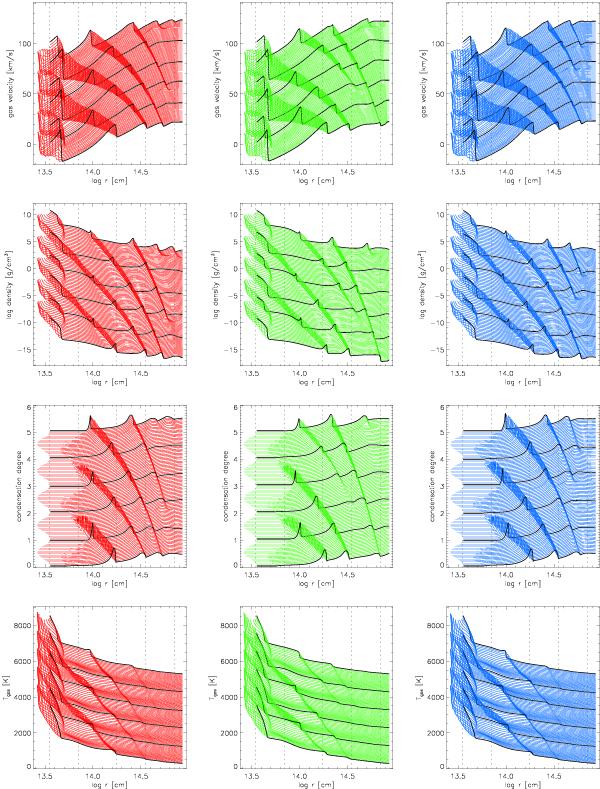
Example of the second page of the fact sheets. The colours in the plots correspond to the selected epochs as given on the first page. In each column we show, from top to bottom, the gas velocity, density, carbon condensation degree, and gas temperature, all as a function of distance from the stellar centre. In each panel, individual curves correspond to snapshots in time, and time increases downwards. The distance between two curves is approximately 0.05 in phase. The curves closest in time to phase 0.0 are drawn with thick black lines. The ordinate scales apply to the bottom (last) curve. The vertical short-dashed lines in the panels denote the distances 1, 2, 5, 10, and 20 stellar radii. Note that time increases downwards. Scales OK for last curve (bottom black).
Current usage metrics show cumulative count of Article Views (full-text article views including HTML views, PDF and ePub downloads, according to the available data) and Abstracts Views on Vision4Press platform.
Data correspond to usage on the plateform after 2015. The current usage metrics is available 48-96 hours after online publication and is updated daily on week days.
Initial download of the metrics may take a while.