Fig. C.1
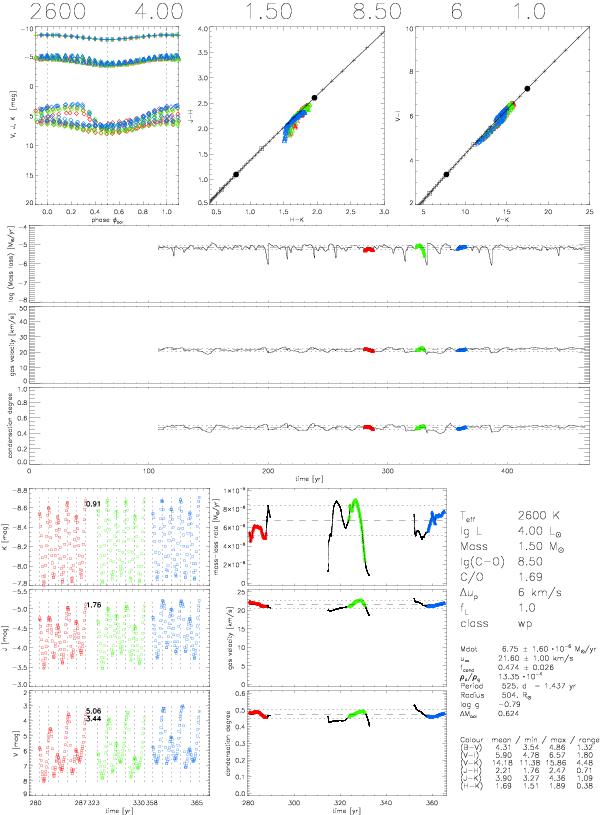
Example of the first page of the fact sheets. The top label gives T⋆, log L⋆, M⋆, log (C–O) + 12, Δup, and fL for a quick overview. The upper leftmost diagram gives the K, J and V magnitudes as a function of phase (with maximum luminosity at phase 0.0). The ranges are identical on all fact sheets to facilitate comparisons of different models; this is true for the three upper diagrams. The different colours correspond to the different epochs selected for the spectral synthesis. The middle and right upper panels show two colour–colour diagrams, the blackbody line is also shown. The three middle panels show, as a function of time, the mass-loss rate, the gas velocity, and the condensation degree for carbon, all three at the outer boundary (25R⋆); here the vertical scales are identical on all fact sheets, the time intervals do vary from model to model. For the models without a wind, the position of the outer boundary is shown instead of the mass-loss rate. For the episodic models, we show both of them. The horizontal dashed and dotted lines denote the mean value, and the mean value ± the standard deviation. The bottom part contains the light-curves in K, J and V; here the dotted vertical lines denote the positions of the luminosity maxima, the maximum range in magnitudes is also given, for the V magnitude also the mean amplitude over a (luminosity) cycle. Enlarged versions of the three middle plots, now with automatic scaling, are shown for the selected epochs. Finally, a summary of parameters, dynamic and photometric properties are listed.
Current usage metrics show cumulative count of Article Views (full-text article views including HTML views, PDF and ePub downloads, according to the available data) and Abstracts Views on Vision4Press platform.
Data correspond to usage on the plateform after 2015. The current usage metrics is available 48-96 hours after online publication and is updated daily on week days.
Initial download of the metrics may take a while.