Fig. 1
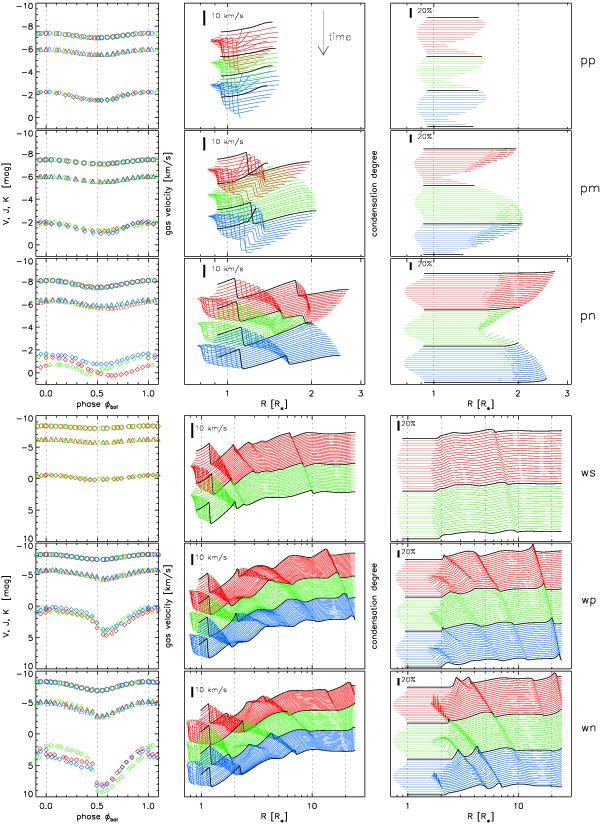
Photometry and radial structures for representative models (see Table A.1) without wind (upper 3 rows, classes pp, pm, pn) and for models with winds (lower 3 rows, classes ws,wp, wn). The leftmost panels show the brightness in the V (diamonds), J (triangles) and K (circles) filters as a function of bolometric phase (with phase φbol = 0.0 at maximum light). Points belonging to the same pulsation cycle have the same colour. Note that the photometric scales are different for models with and without winds. Middle panels show radial profiles of the gas velocity. Each curve represents a snapshot in time, the first at the top and later ones displaced by a fixed amount downwards. The colours denote the different pulsation cycles and correspond to the colours in the leftmost panels. Black curves correspond to φbol = 0.0. Vertical dotted lines mark the distances 1, 2, 5, 10, and 20 stellar radii from the stellar centre. A velocity range of 10 km s-1 is marked with bars. The rightmost panels show radial profiles of the condensation degree of carbon plotted in the same way as the velocities, here the bars mark a condensation degree of 20%.
Current usage metrics show cumulative count of Article Views (full-text article views including HTML views, PDF and ePub downloads, according to the available data) and Abstracts Views on Vision4Press platform.
Data correspond to usage on the plateform after 2015. The current usage metrics is available 48-96 hours after online publication and is updated daily on week days.
Initial download of the metrics may take a while.