Fig. 8
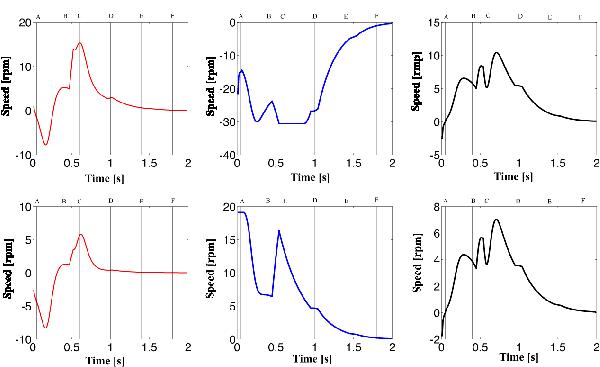
Velocity profiles that correspond to the pairs of actuators for positioners 1, 2, and 3 in Fig. 7. Columns show the velocity profiles for each positioner. The first and second profiles of each column correspond to the first and second actuators of each positioner, respectively. Vertical lines indicate the moment at which the snapshots in Fig. 7 were taken.
Current usage metrics show cumulative count of Article Views (full-text article views including HTML views, PDF and ePub downloads, according to the available data) and Abstracts Views on Vision4Press platform.
Data correspond to usage on the plateform after 2015. The current usage metrics is available 48-96 hours after online publication and is updated daily on week days.
Initial download of the metrics may take a while.