Fig. 3
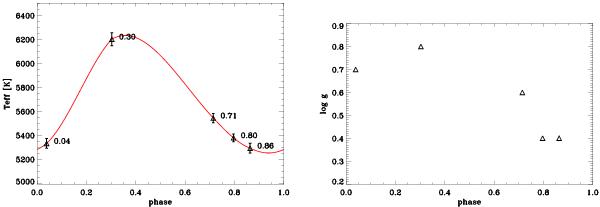
Top: effective temperature curve vs. pulsational phase for the Cepheid RY Sco as derived using the LDRs method (see text for details). The adopted spectra are the same as in Fig. 1. The Teff estimates derived for each spectrum and its error are plotted as black triangles. The red line shows the spline fit. The numbers plotted on top of the individual measurements show the pulsation phase. Bottom: same as the top, for the surface gravity.
Current usage metrics show cumulative count of Article Views (full-text article views including HTML views, PDF and ePub downloads, according to the available data) and Abstracts Views on Vision4Press platform.
Data correspond to usage on the plateform after 2015. The current usage metrics is available 48-96 hours after online publication and is updated daily on week days.
Initial download of the metrics may take a while.