Fig. 9
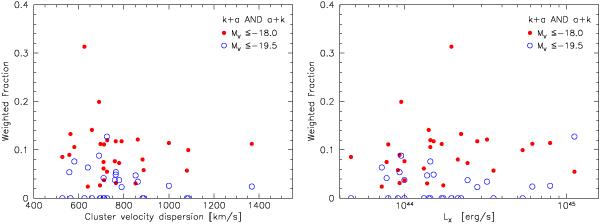
Fraction of post-starburst galaxies as a function of the two cluster mass tracers, velocity dispersion (left) and LX (right). k+a and a+k are considered as one single class. As done for Fig. 7, only galaxies within R500 are taken into account. Points with different colours refer to different magnitude limits and are used later on for a comparison with high redshifts samples.
Current usage metrics show cumulative count of Article Views (full-text article views including HTML views, PDF and ePub downloads, according to the available data) and Abstracts Views on Vision4Press platform.
Data correspond to usage on the plateform after 2015. The current usage metrics is available 48-96 hours after online publication and is updated daily on week days.
Initial download of the metrics may take a while.