Fig. 5
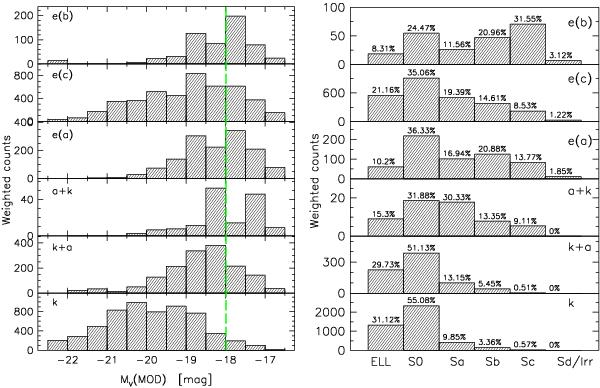
Left panel: shaded histograms represent the number of galaxies in the six spectral types as a function of the absolute V magnitude; the green-dashed line marks the magnitude limit of the subsample used in the analysis (for this plot only, we consider no cut in magnitude). Galaxies brighter than MV = −22.5 are included in the brightest bin. Right panel: occurrence of morphological types as a function of the spectral class. The percentages refer to the number of objects with a given morphology with respect to each spectroscopic class. For both plots, data have been weighted by both magnitude and geometric completeness. For the right-hand plot only galaxies with MV < −18 have been considered.
Current usage metrics show cumulative count of Article Views (full-text article views including HTML views, PDF and ePub downloads, according to the available data) and Abstracts Views on Vision4Press platform.
Data correspond to usage on the plateform after 2015. The current usage metrics is available 48-96 hours after online publication and is updated daily on week days.
Initial download of the metrics may take a while.