Fig. 3
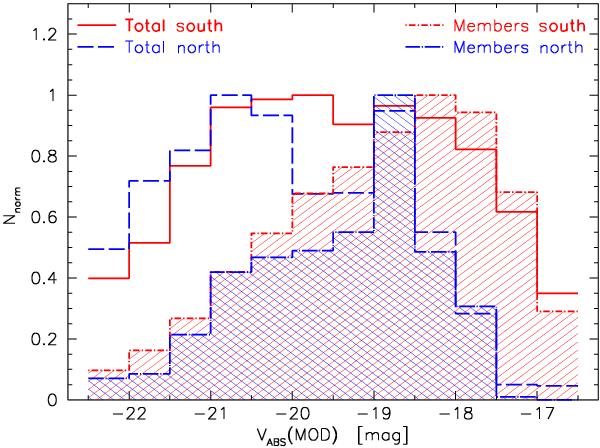
Distributions of absolute V magnitude for galaxies in the north and south samples (different colours and lines). Absolute magnitudes are computed as the integral convolution between the rest-frame model spectrum and the V-band transmission curve. All distributions are normalised to their peak number, and both magnitude and geometrical completenesses are taken into account.
Current usage metrics show cumulative count of Article Views (full-text article views including HTML views, PDF and ePub downloads, according to the available data) and Abstracts Views on Vision4Press platform.
Data correspond to usage on the plateform after 2015. The current usage metrics is available 48-96 hours after online publication and is updated daily on week days.
Initial download of the metrics may take a while.