Fig. 2
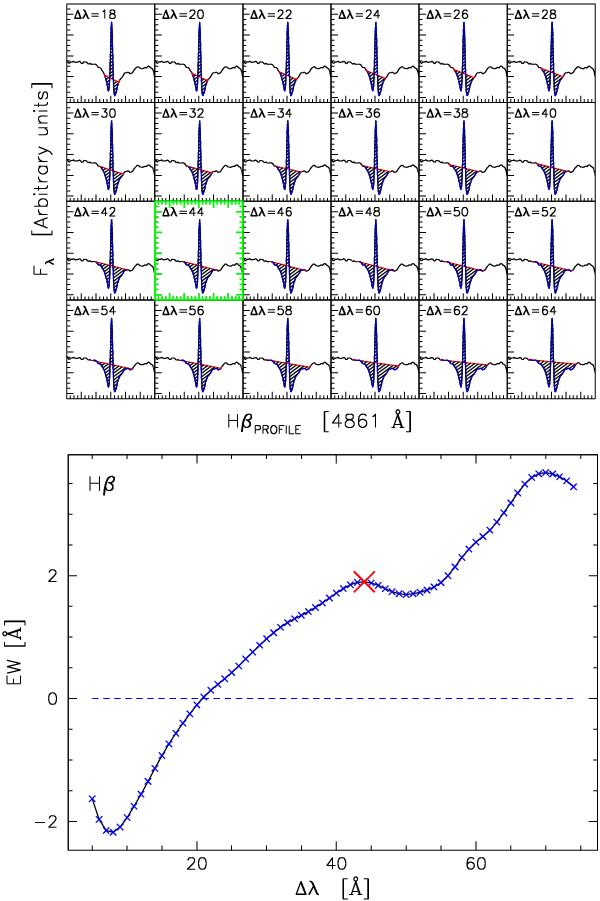
Illustration of how our EW measurement method works on an observed Hβ line: in the upper panel we show how the EW is iteratively measured at increasingly larger Δλ (red, straight line) which are also used to define the continuum level. The dashed regions correspond to the area measured for the EW determination. The analysis of the EW trend curve, plotted on the lower panel, provides the correct observed value, shown by the red cross. In this case, in which both emission and absorption components are present, it corresponds to the second zero of the first derivative of the trend curve itself.
Current usage metrics show cumulative count of Article Views (full-text article views including HTML views, PDF and ePub downloads, according to the available data) and Abstracts Views on Vision4Press platform.
Data correspond to usage on the plateform after 2015. The current usage metrics is available 48-96 hours after online publication and is updated daily on week days.
Initial download of the metrics may take a while.