Fig. 10
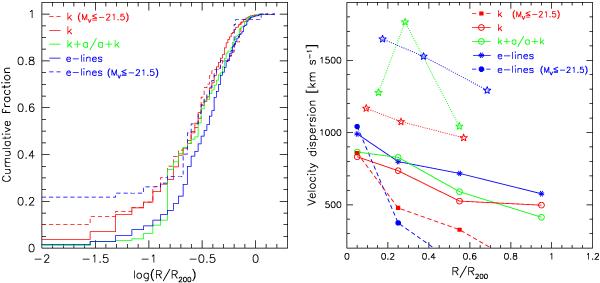
Left-hand panel: cumulative radial distribution of the three spectral types as defined in the text. Right-hand: average velocity dispersion in bins of radial distance for the three main spectral classes. Void stars represent the high-z data points from Dressler et al. (1999). In all cases, the distances are calculated from the cluster’s BCG and are expressed in terms of R200.
Current usage metrics show cumulative count of Article Views (full-text article views including HTML views, PDF and ePub downloads, according to the available data) and Abstracts Views on Vision4Press platform.
Data correspond to usage on the plateform after 2015. The current usage metrics is available 48-96 hours after online publication and is updated daily on week days.
Initial download of the metrics may take a while.