Fig. 5
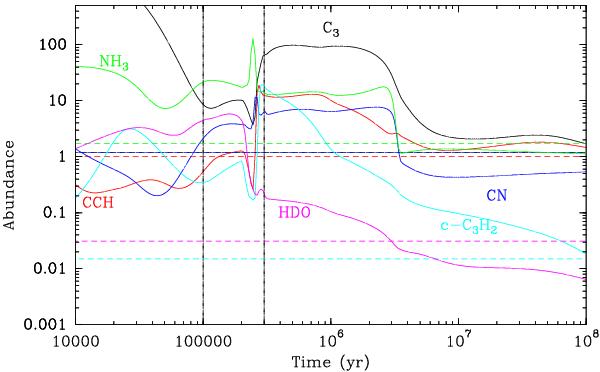
Calculated abundances of different species relative to the observed column density of CCH, as a function of time for a constant density n(H2) = 5 × 105 cm-3 and a warm-up to Tmax = 30 K from 10 K, where the warm-up and other conditions are described in Sect. 6. The dashed horizontal lines correspond to the observed abundances and are color-coded with the calculated abundances. The vertical lines at t = 0.1 and 0.3 Myr indicate the onset and end of warm-up of grains, respectively.
Current usage metrics show cumulative count of Article Views (full-text article views including HTML views, PDF and ePub downloads, according to the available data) and Abstracts Views on Vision4Press platform.
Data correspond to usage on the plateform after 2015. The current usage metrics is available 48-96 hours after online publication and is updated daily on week days.
Initial download of the metrics may take a while.