Fig. 4
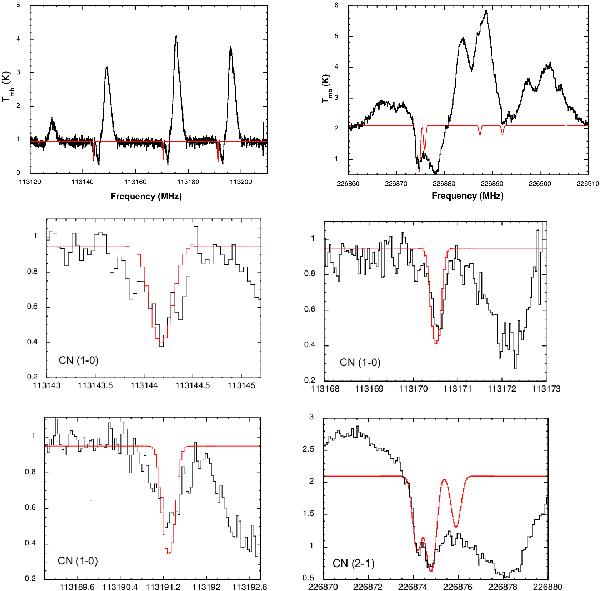
Top panels: observed spectra of CN 1–0 (left) and CN 2–1 (right) shown in black. We also show the best-fit LTE model (using the CASSIS software) corresponding to Tex = 3 K, vLSR= 69.5 km s-1, Δv = 0.6 km s-1, and NCN = 5.8×1013 cm-2. The data and the relevant best-fit model spectra are enlarged in the four panels below. The details of the CN(1–0) transitions are middle row left: 1, 1/2, 1/2–0, 1/2, 3/2 and right: 1, 1/2, 3/2–0, 1/2, 1/2; bottom row left: 1, 1/2, 3/2–0, 1/2, 3/2.
Current usage metrics show cumulative count of Article Views (full-text article views including HTML views, PDF and ePub downloads, according to the available data) and Abstracts Views on Vision4Press platform.
Data correspond to usage on the plateform after 2015. The current usage metrics is available 48-96 hours after online publication and is updated daily on week days.
Initial download of the metrics may take a while.