Fig. 3
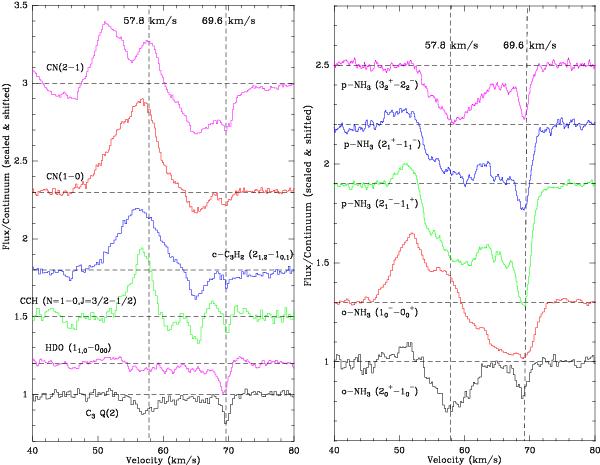
Left: comparison of velocity structure seen in C3 spectra with that seen in transitions of CCH, c-C3H2, HDO, and CN. The H O spectrum along with a Gaussian fit are taken from Flagey et al. (2013). Right: multiple transitions of NH3 observed with Herschel. The dashed vertical lines correspond to the 57.8 and 69.6 km s-1 components as found in the C3 observations (see Table 4).
Current usage metrics show cumulative count of Article Views (full-text article views including HTML views, PDF and ePub downloads, according to the available data) and Abstracts Views on Vision4Press platform.
Data correspond to usage on the plateform after 2015. The current usage metrics is available 48-96 hours after online publication and is updated daily on week days.
Initial download of the metrics may take a while.