Free Access
Fig. 1
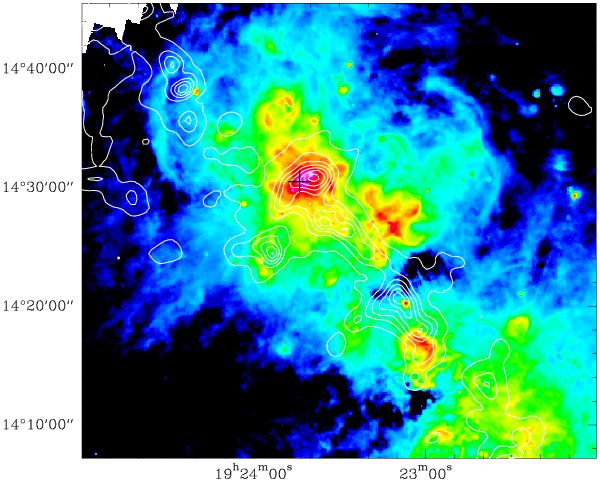
Color image shows 70 μm continuum emission observed with PACS. The white contours represent 13CO (1–0) emission integrated between 68.9 and 70.3 km s-1 corresponding to the “filament”, observed using FCRAO as part of the Galactic Ring Survey. The black cross shows the position of the HIFI observations.
Current usage metrics show cumulative count of Article Views (full-text article views including HTML views, PDF and ePub downloads, according to the available data) and Abstracts Views on Vision4Press platform.
Data correspond to usage on the plateform after 2015. The current usage metrics is available 48-96 hours after online publication and is updated daily on week days.
Initial download of the metrics may take a while.