Free Access
Fig. 14
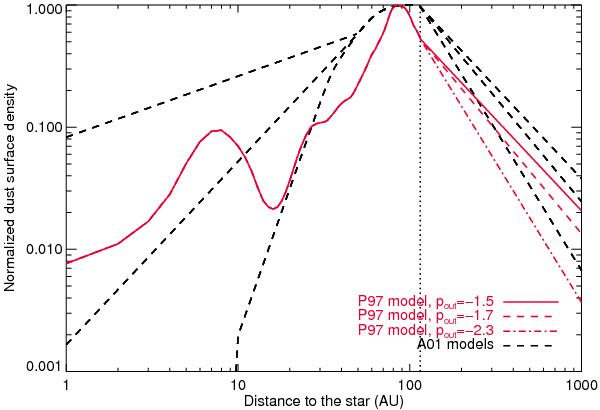
Comparison between the P97 and A01 models. The vertical dotted line indicates the separation of 115 AU beyond which the dust surface density inverted from the 12 μm observations was interpolated with power laws.
Current usage metrics show cumulative count of Article Views (full-text article views including HTML views, PDF and ePub downloads, according to the available data) and Abstracts Views on Vision4Press platform.
Data correspond to usage on the plateform after 2015. The current usage metrics is available 48-96 hours after online publication and is updated daily on week days.
Initial download of the metrics may take a while.