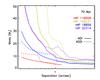
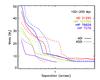
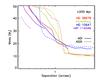
Fig. 9
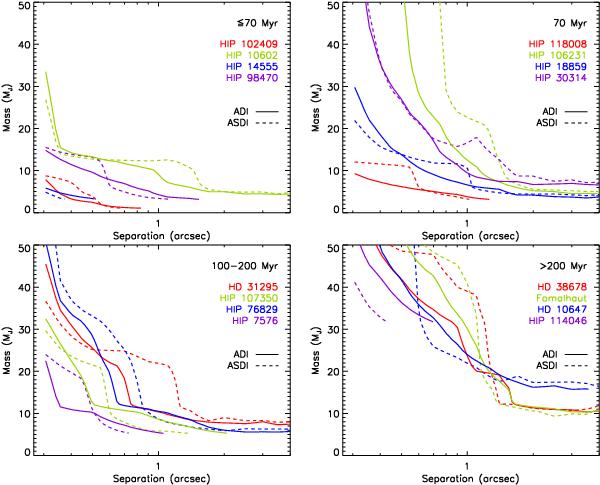
Detection limits in mass of the survey according to the BT-Settl evolutionary model (Allard et al. 2012) after ADI applied to the I1 image (solid curves) and after ASDI performed for the I13b subtraction (dashed curves). The stars are sorted by increasing age from left to right and from top to bottom. The curves are cut when the minimum mass covered by the evolutionary model is reached (see text).

Current usage metrics show cumulative count of Article Views (full-text article views including HTML views, PDF and ePub downloads, according to the available data) and Abstracts Views on Vision4Press platform.
Data correspond to usage on the plateform after 2015. The current usage metrics is available 48-96 hours after online publication and is updated daily on week days.
Initial download of the metrics may take a while.