Fig. 8
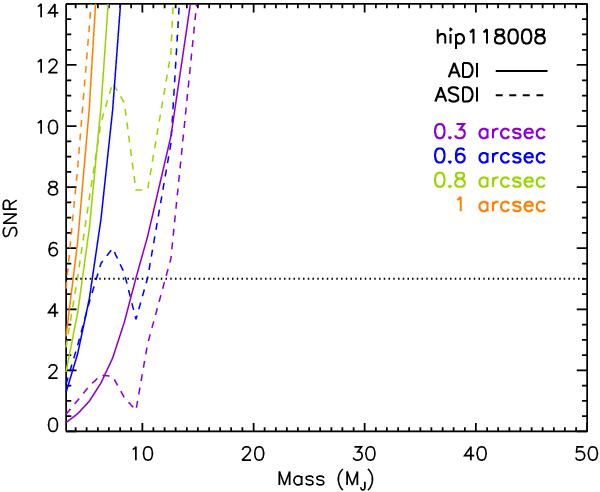
Signal-to-noise ratio of synthetic planets measured in the images of HIP 118008 after ADI (solid lines) and ASDI (dashed lines) as a function of mass for several separations. The cut-off at low masses is due to the evolutionary model BT-Settl (see text). The horizontal dotted black line indicates the signal-to-noise ratio used to derive the mass sensitivity limits (see text).
Current usage metrics show cumulative count of Article Views (full-text article views including HTML views, PDF and ePub downloads, according to the available data) and Abstracts Views on Vision4Press platform.
Data correspond to usage on the plateform after 2015. The current usage metrics is available 48-96 hours after online publication and is updated daily on week days.
Initial download of the metrics may take a while.