Fig. 5
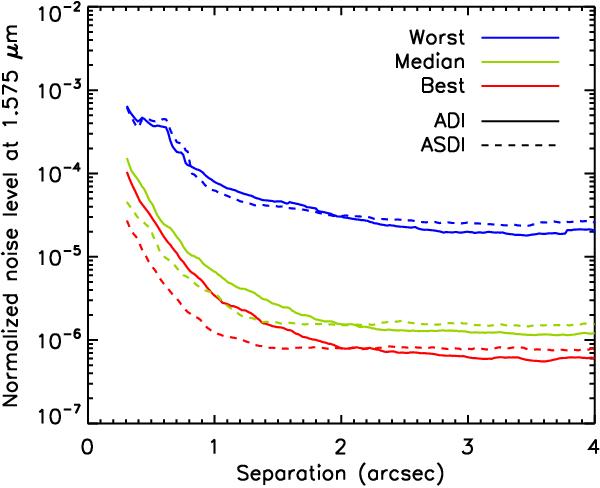
Residual noise in the I1 image expressed in contrast with respect to the star after ADI alone (solid lines) and after ASDI (dashed lines). We consider for ASDI the subtraction I13b. We represent the median, best, and worst curves in the survey (colored curves, see text). We account for self-subtraction from ADI for all curves using synthetic planets, but not from SDI for the ASDI curves (see text).
Current usage metrics show cumulative count of Article Views (full-text article views including HTML views, PDF and ePub downloads, according to the available data) and Abstracts Views on Vision4Press platform.
Data correspond to usage on the plateform after 2015. The current usage metrics is available 48-96 hours after online publication and is updated daily on week days.
Initial download of the metrics may take a while.