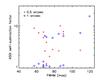
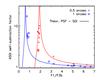
Fig. A.2

ASDI self-subtraction factor as a function of the PSF FWHM (left) and the planet flux ratio (right) derived for two separations to the image center. For the right panel, we also represent the theoretical curves for the self-subtraction measured on a diffraction-limited PSF processed in SDI alone (no ADI) as a function of the flux ratio (solid lines). The measurements and the theoretical curve determined at 0.5′′ are shifted horizontally by 1 unit toward the right with respect to the data obtained at 1′′ for the sake of clarity. Also note the point representing HIP 106231 at 0.5′′, which is outside the plot ranges (FWHM = 119 mas, F1/F3b = 0.9, ASDI self-subtraction = 100).
Current usage metrics show cumulative count of Article Views (full-text article views including HTML views, PDF and ePub downloads, according to the available data) and Abstracts Views on Vision4Press platform.
Data correspond to usage on the plateform after 2015. The current usage metrics is available 48-96 hours after online publication and is updated daily on week days.
Initial download of the metrics may take a while.