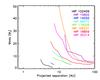
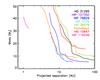
Fig. 13

Detection limits in mass using BT-Settl (Allard et al. 2012) and combining several differential imaging methods (see text) as a function of the projected separation. The left panel represents the results for the stars younger than 100 Myr and the right panel those for older targets. The curves are cut according to the maximum projected separation accessible in the SDI field (see text).
Current usage metrics show cumulative count of Article Views (full-text article views including HTML views, PDF and ePub downloads, according to the available data) and Abstracts Views on Vision4Press platform.
Data correspond to usage on the plateform after 2015. The current usage metrics is available 48-96 hours after online publication and is updated daily on week days.
Initial download of the metrics may take a while.