Fig. 9
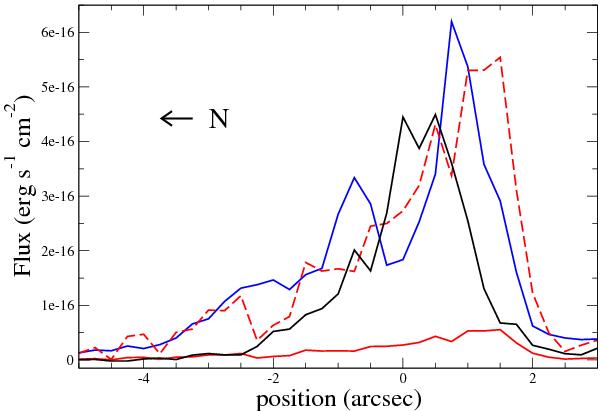
Emission profiles of the UV continuum (1224.5 Å rest frame, black), primary Lyα (blue), and secondary Lyα (red) emissions from HST/STIS data. The vertical scale corresponds to the Lyα flux. The secondary emission has been scaled by a factor 10 (dashed red line) to ease the comparison. Spatial resolution of all the profiles was degraded to 0.25 arcsec pixel-1.
Current usage metrics show cumulative count of Article Views (full-text article views including HTML views, PDF and ePub downloads, according to the available data) and Abstracts Views on Vision4Press platform.
Data correspond to usage on the plateform after 2015. The current usage metrics is available 48-96 hours after online publication and is updated daily on week days.
Initial download of the metrics may take a while.